Detection, Attribution, and Prediction of Stratospheric Change
As the focus is on tropospheric climate, most IPCC climate models (AOGCMs) resolve only the lower stratosphere as a sponge layer at the upper boundary. Thus, while the vertical coupling of the atmosphere with the ocean at the lower boundary is well represented by the IPCC models, the coupling with the upper atmosphere has been neglected so far in IPCC climate change assessments. However, there is growing evidence that the stratosphere, albeit having only about 10% of the atmosphere’s mass, plays a significant role in the future evolution of climate. It is well documented that the stratosphere acts as an ‘early warning system’ for climate change, as signatures of changes are often more robust in the stratosphere than in the troposphere. Thus the monitoring and detection of stratospheric changes is of special relevance for the attribution of climate change. For example, lower stratospheric water vapour (H2O) for example showed an unexpected but significant decline since 2001, as shown for Boulder (Colorado) in Figure 1. Concurrently a significant decrease in tropical tropopause temperatures was measured which suggests that the low H2O values are the result of an increase in tropical upwelling (Randel et al., 2006) possibly due to increased GHG concentrations. Important current research issues are how stratospheric O3, H2O, and other constituents evolve in a future atmosphere with enhanced GHG concentrations, and how these changes in stratospheric composition will affect climate.
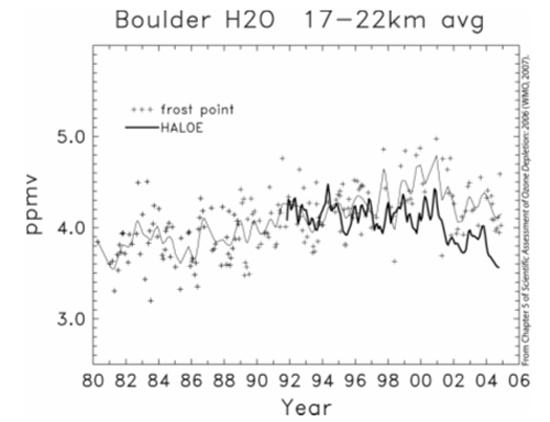
Figure 1: Evolution of stratospheric water vapour mixing ratio (in ppmv, averaged over 17-22 km) at Boulder, Colorado (40°N, 105°W), derived from balloon-borne frost point hygrometer measurements covering 1980-2005. The thin line shows a smooth fit through the data points, using a running Gaussian window with a half-width of three months. The heavy line shows HALOE satellite water vapour data during 1992-2005 for the same altitude region, using measurements near Boulder(over latitudes 35°N-45°N, and longitudes 80°W-130°W). (Figure taken from WMO, 2007.)

