Contribution to WMO
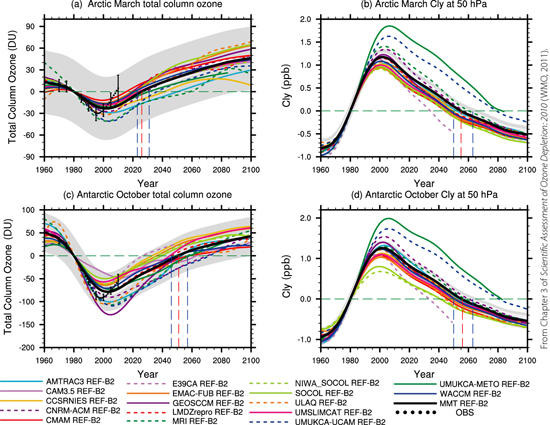
1980 baseline-adjusted multi-model trend estimates and individual model trends (coloured lines) of annually averaged total column ozone (DU; left) and Cly at 50 hPa (ppb; right) for the latitude range 60°N–90°N in March (upper row) and the latitude range 60°S–90°S in October (lower row). The red vertical dashed line indicates the year when the multi-model trend in total column ozone and Cly at 50 hPa returns to 1980 values and the blue vertical dashed lines indicate the uncertainty in these return dates. The black dotted lines in the left panels show observed total column ozone (from Chapter 3 of ‘Scientific Assessment of Ozone Depletion: 2010 (WMO, 2011)).

