Self Assessment
Here, you can check the knowledge you gained during the first chapter.
Please, work through the following exercises.
You can verify your results by expanding the corresponding 'Spoiler'-boxes at the bottom of this page, which will contain a correct solution.
1.1: Geometry-Tools
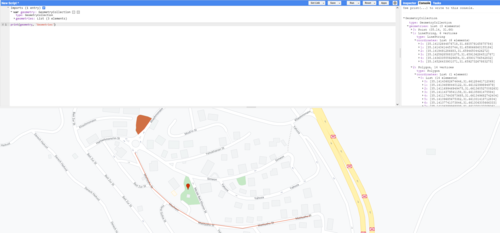
Create a Point- Line- and Polygon-Geometry using the Geometries-Tool in the Map Panel to mark areas, locations or objects of your choice. Print your geometries to the console and have a look at their properties.
1.2: Basic JavaScript in GEE
Create variables for the following tasks and print them to the console:
- Create a variable containing the string 'Class 1'
- Create a variable containing the number 8
- Create a list containing the numbers 2, 4, 8, 16, 32, 64, 128, 256
- Add a comment to a random variable
1.3: Accessing and Filtering Data
Access Sentinel-2 Level 2A image data.
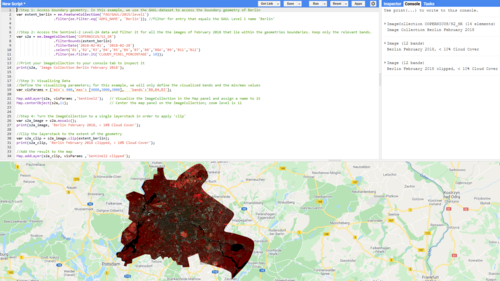
Filter it to obtain only the images of February 2018 for a research area of your choice that has a cloudy pixel percentage of less than 10%. Print the result to the Console Panel and appropriately display it in the Map Panel.
Clip the data to only show the relevant research area.
1.4: Charts
Create a chart showing the Surface Reflectance Values of the Near Infrared Band for your research area from 1.3.


