Inputdata
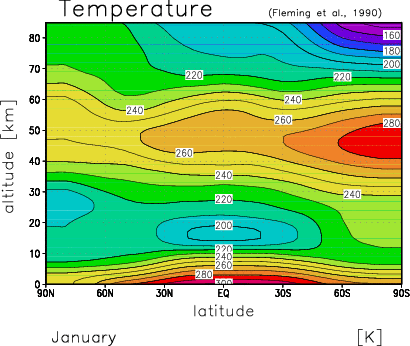
Temperature (temp) Data:
------------------------
CIRA 86 (Fleming et al, 1990)
Vertical interpolation to 1km level spacing
Horizontal interpolation to 5 deg latitude interval
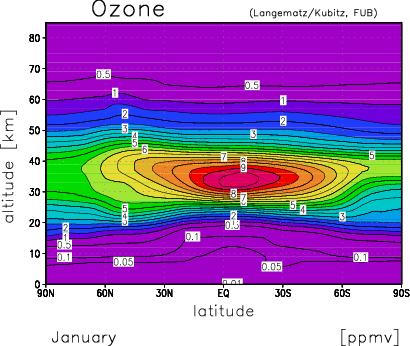
Ozone (o3) Data:
----------------
FUB-ozone climatology (version 02, updated from
Fortuin and Langematz, 1994), at 5 deg latitude intervals
CIRA satellite climatology, combined with tropospheric
ozone sonde data
At 5 deg latitude intervals
Vertical interpolation to 1km level spacing
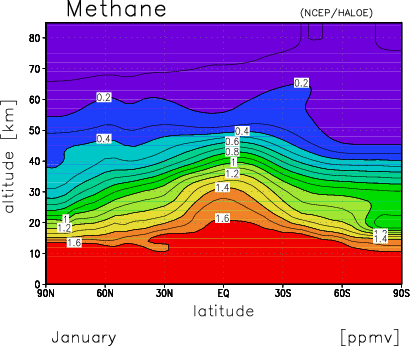
Methan (ch4) Data:
------------------
HALOE observations above 13 km, at 5 deg latitude intervals
(Data provided by C. Bruehl, MPI Mainz)
Above 80 km constant values.
Below 9 km constant value of 1.7 ppmv,
also set to 1.7 ppmv in tropical upper troposphere (15S-10N
13-14km) to supress unrealistic values in this region.
Vertical interpolation to 1km level spacing
Interpolation between 9 and 13 km
Time interpolation from 2-month-means to the 15th of January
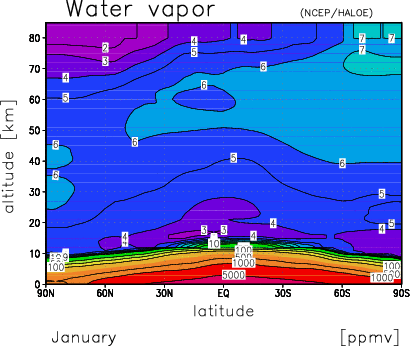
Water vapour (h2o) Data:
------------------------
HALOE observations above 12 km, at 5 deg latitude intervals
(Data provided by C. Bruehl, MPI Mainz)
Time interpolation from 2-month-means to the 15th of January
NCEP/NCAR global reanalyses below 8 km
(Data provided by D. Shea, NCAR)
Horizontal interpolation to 5 deg latitude interval
Vertical interpolation to 1km level spacing
Interpolation in transition region
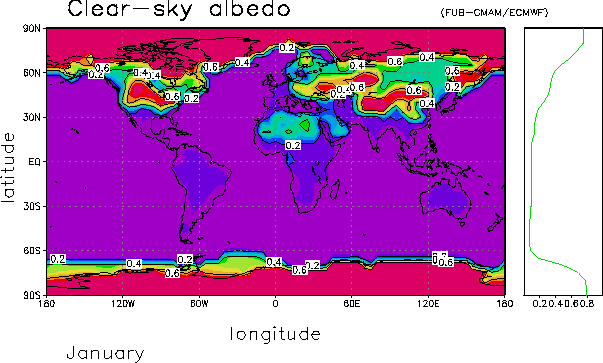
Albedo:
-------
Values from Berlin CMAM
In the model, albedo depends on surface charcteristics
(land, sea, ice, vegetation)
Mean of 30-day integration under perpetual January conditions
Horizontal interpolation from 5.6 x 5.6 to 5 x 5 degrees
Zenith-angle:
-------------
Cosine of zenith-angle computed by the Berlin CMAM
Values for daily mean at the 15th of January
Horizontal interpolation to 5 deg latitude interval