Statistics and Geodata Analysis using R and Python
Welcome to the new and extended E-Learning project Statistics and Geodata Analysis SOGA.
Now, we are providing the content of our project in the two datascience languages R and Python separately:
Both projects are organised in four main chapters:
- Introduction to R/Python
- Basics of statistics
- Advanced statistics
- Introduction to Machine Learning
The E-Learning modules teach fundamental and advanced mathematical and statistical concepts and methods for data analysis. The datasets that will be analysed are related to field of Environmental Earth Science, including Climatology, Hydrology, Paleoclimatology, Geochemistry, Remote Sensing, among others. The methods are applied to real world datasets in form of hands-on coding exercises using the programming languages R and Python. The coding will cover the entire analysis pipeline, from data import, through data cleaning and wrangling, to exploratory data analysis, including visualisation, modelling, and interpretation of results.
Each section is made up of a number of subsections and lessons that cover a specific topic. These lessons build on each other, so it is recommended that you work through them in the order they are presented. However, if you are already familiar with a particular topic, feel free to skip that lesson and focus on the lessons that are of interest to you.
Some of the subsections conclude with a hands-on programming exercise. In the exercises, you will be asked to programmatically solve problems based on either toy datasets or real-world datasets.
This project bundle is all about processing and understanding data, with a special focus on earthscience data. In a more general sense the project is all about Data Science. Data Science itself is an interdisciplinary field about processes and systems to extract knowledge from data applying various methods drawn from a broad field of different scientific disciplines, such as mathematics, statistics, and computer science, among others.
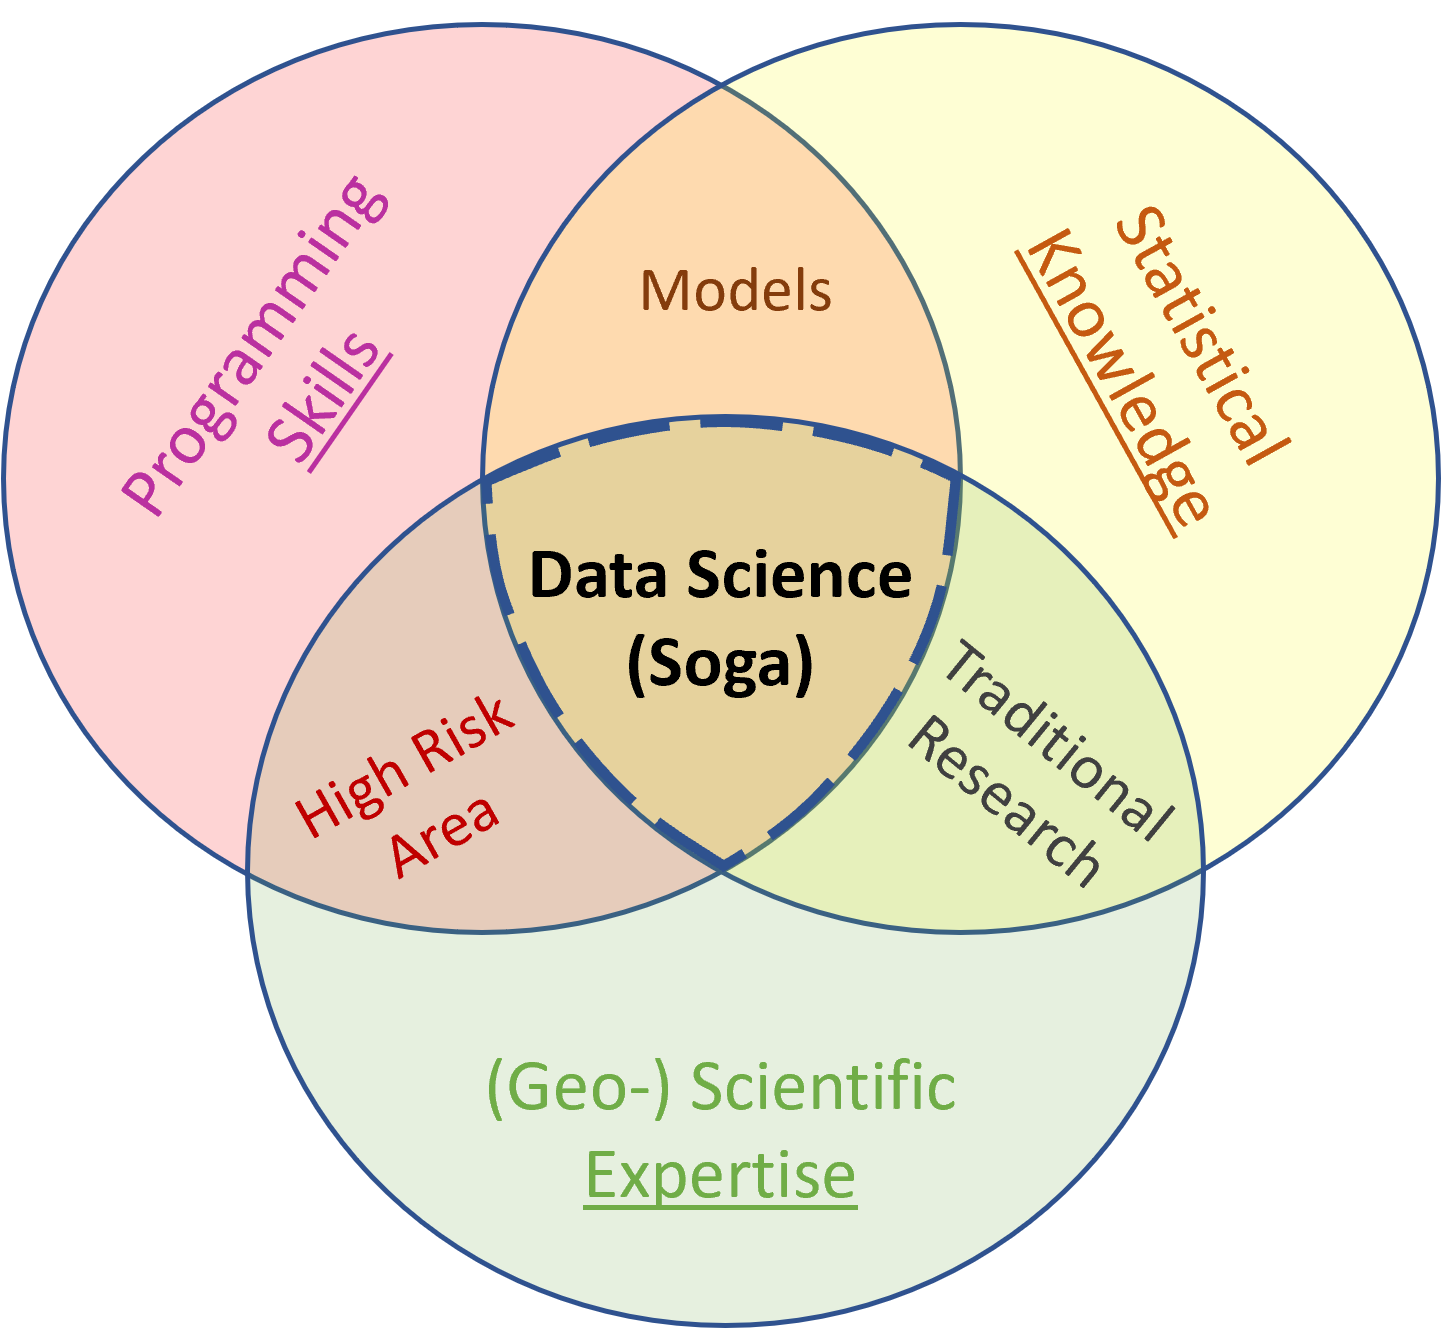
Source: Modified after blog of Drew Conway (2010, http://drewconway.com/zia/2013/3/26/the-data-science-venn-diagram)
As shown above in the Venn diagram modified after Drew Conway (2010) to do data science we need a substantive expertise and domain knowledge, which in our case is the field of Earth Sciences, respectively Geosciences. In addition we need to know about mathematics and statistics, which is known as the arts of collecting, analysing, interpreting, presenting (visualizing), and organising data. The main focus of the present E-Learning project is on statistics: Yes, we will learn statistics!
Last but not least we must develop programming skills. For our purpose this means that we need to learn how to load/save, manipulate, visualise, and analyse (geospatial) data. We will develop programming skills by learning and applying the statistical programming languages R and Python.
We will cover a lot of ground and it will need stamina and dedication to work through all of that. However, it will pay off!
Be aware that the beginning of the Digital Age may be dated around the year 2002, when more than 50% of the data worldwide available had been stored digitally in contrast to data stored in analogues forms (Hilbert and López 2011).
Since the 17th century, scientists have recognised experimental and theoretical science as the basic research paradigms for understanding nature. In recent decades, computer simulations have become an essential third paradigm. Nowadays, at the dawn of the Big Data Era, a fourth paradigm is emerging, consisting of the techniques and technologies needed to perform data-intensive science (Bell et al, 2009). Data-intensive science will be integral to many future scientific endeavours, but demands specialised skills and analysis tools (e.g. NASA´s Earth Observing System Data and Information System, EarthServer or Google Earth Engine). Therefore you should not be surprised that in an article published in the Harvard Business Review the job as a data scientist - or call it statistician - is described as the sexiest job of the 21st century (Davenport and Patil, 2010).
Please note that the content of the present E-Learning project complements and extends the material covered in the classes Introduction to Statistics and Geostatistics, both taught at the Department of Geosciences at Freie Universitaet Berlin.
Have fun to learn more on statistics and geospatial data analysis!
Source: http://xkcd.com/552/
Citation and funding
The E-Learning project SOGA funded by CEDIS of FU-Berlin was first developed at the Department of Earth Sciences by Kai Hartmann, Joachim Krois and Björn Waske in 2018.
Five years later, due to the high demand, SOGA was updated, supplemented and expanded under the leadership of Kai Hartmann, Annette Rudolph and Joachim Krois and conducted together with Benjamin Schmidt, Patric Hausmann, Anne Gossing, Marie-Christin Eckert, Jana Frenzel, Daniel Kruppke-Hansen, Johanna Boose and Johannes Zieger. Furthermore, many students, colleagues and user contributed by their valuable feedback.

You may use this project freely under the Creative Commons Attribution-ShareAlike 4.0 International License. Please cite as follows:
SOGA-R: Hartmann, K., Krois, J., Rudolph, A. (2023): Statistics and Geodata Analysis using R (SOGA-R). Department of Earth Sciences, Freie Universitaet Berlin.
SOGA-Py: Rudolph, A., Krois, J., Hartmann, K. (2023): Statistics and Geodata Analysis using Python (SOGA-Py). Department of Earth Sciences, Freie Universitaet Berlin.